
Pre-Statistics and Data Science is the foundation you need before diving into data science. It helps beginners understand basic math, logic, and problem-solving skills that are essential when working with data. This guide breaks it all down in simple terms, with real examples and visuals to make it easy to follow.
Introduction: Why Learn Pre-Statistics and Data Science?
Let’s say you want to learn data science.
You’ve heard about Python, machine learning, or data analysis. But once you start, you get stuck. You see confusing formulas or charts. That’s where Pre-Statistics and Data Science comes in.
This is the starting point—a bridge between your current knowledge and the data skills you want to learn.
What Is Pre-Statistics and Data Science?
Pre-Statistics and Data Science refers to the foundational concepts that prepare you for real data science work.
It includes:
- Basic math (percentages, ratios, averages)
- Logic and problem-solving
- Understanding charts and graphs
- Introduction to statistics
- Getting comfortable with data tools
Think of it like learning the alphabet before writing essays.
Why Pre-Statistics Is So Important
You can’t jump straight into advanced data science tools without a base. Without pre-statistics, you may struggle to:
- Read graphs or data tables
- Understand terms like “correlation” or “standard deviation”
- Make decisions based on data
Example:
Imagine you’re told sales grew by 15% last month.
Without basic percentage knowledge, that stat means nothing to you.
Chart: How Pre-Statistics Builds Data Confidence
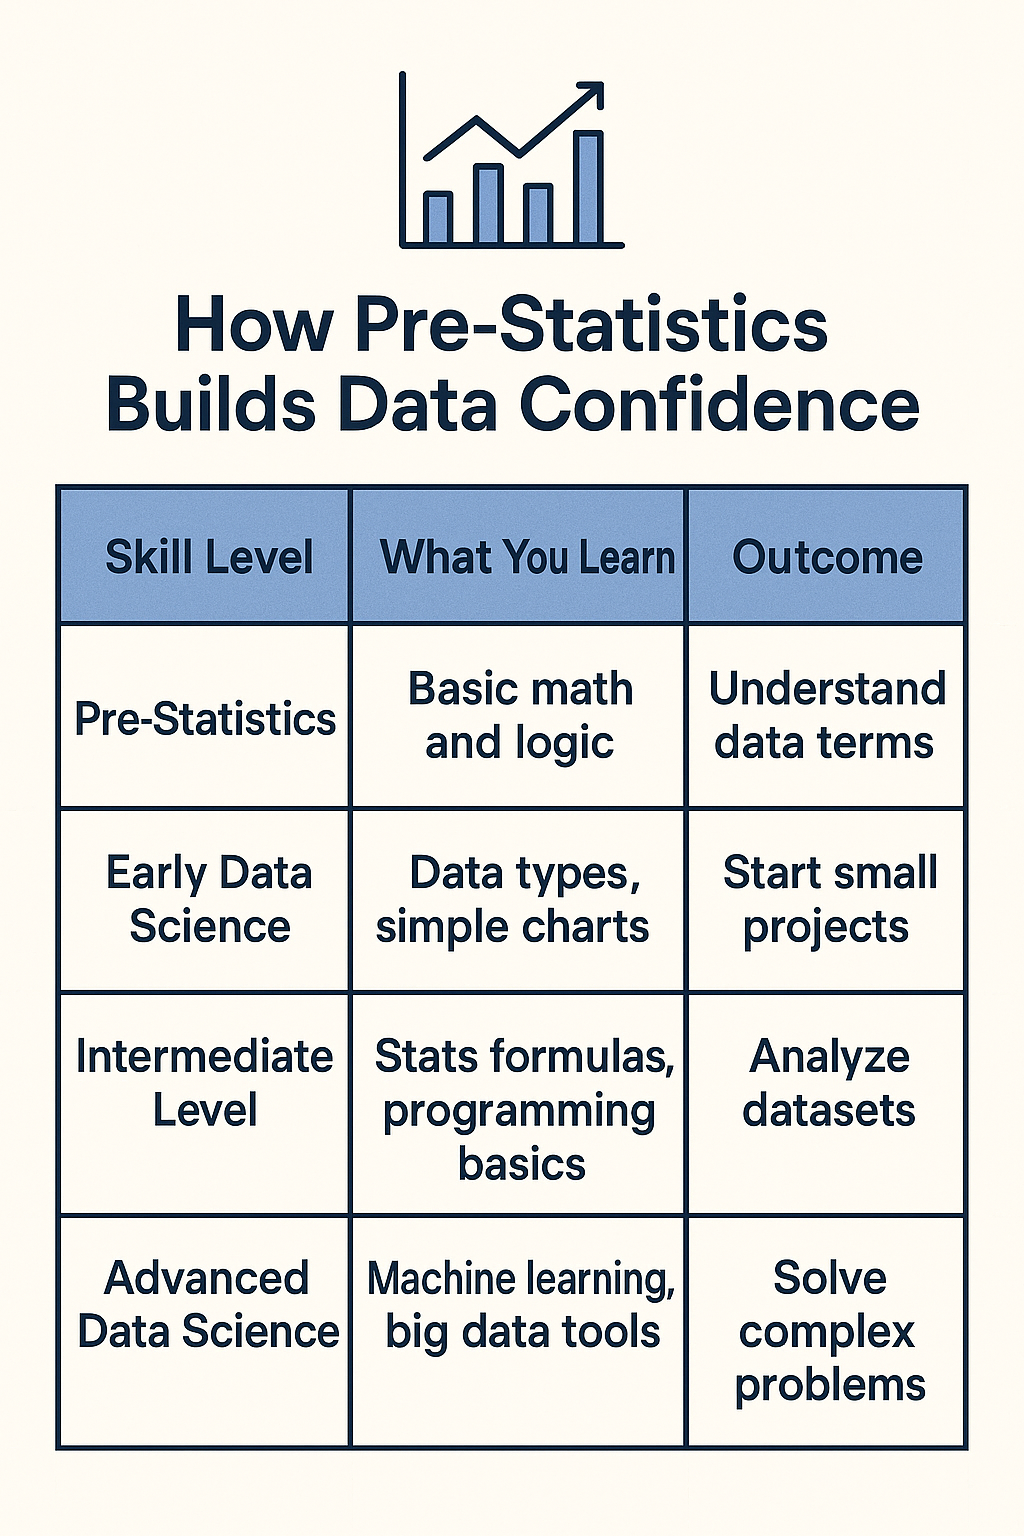
What You’ll Learn in Pre-Statistics and Data Science
Here’s a simple breakdown of what’s typically included:
1. Numbers and Math Basics
- Averages (mean, median, mode)
- Percentages and ratios
- Reading tables and graphs
2. Intro to Statistics
- What is data?
- Types of data (categorical vs. numerical)
- Sample vs. population
3. Logic and Critical Thinking
- Drawing conclusions from patterns
- Understanding cause vs. correlation
4. Simple Visual Tools
- Pie charts, bar graphs, line charts
- Interpreting visuals
5. Hands-on Exercises
Many pre-stat courses include real-life examples like:
- Budget tracking
- Sports stats
- Weather patterns
Real-Life Example
Meet Sarah, a college student who wanted to become a data analyst.
She jumped straight into a Python data course. But she got stuck trying to understand terms like “variance” and “distribution.”
After going back and completing a Pre-Statistics and Data Science course, she could finally:
- Interpret charts
- Understand formulas
- Write her first simple analysis
Common Topics You’ll See
| Topic | Description | Everyday Example |
| Mean & Median | Averages and middle values | Calculating exam score average |
| Probability | Chances something will happen | Weather forecasts |
| Variance | How spread out the data is | Salary differences in a team |
| Bar Graphs | Comparing items visually | Favorite snacks poll results |
| Pie Charts | Showing parts of a whole | Budget breakdown |
Who Should Learn Pre-Statistics and Data Science?
This is perfect for:
- High school students
- College freshmen
- Career switchers
- Anyone new to data
If you’re planning to study data science, data analytics, or machine learning, this is your first step.
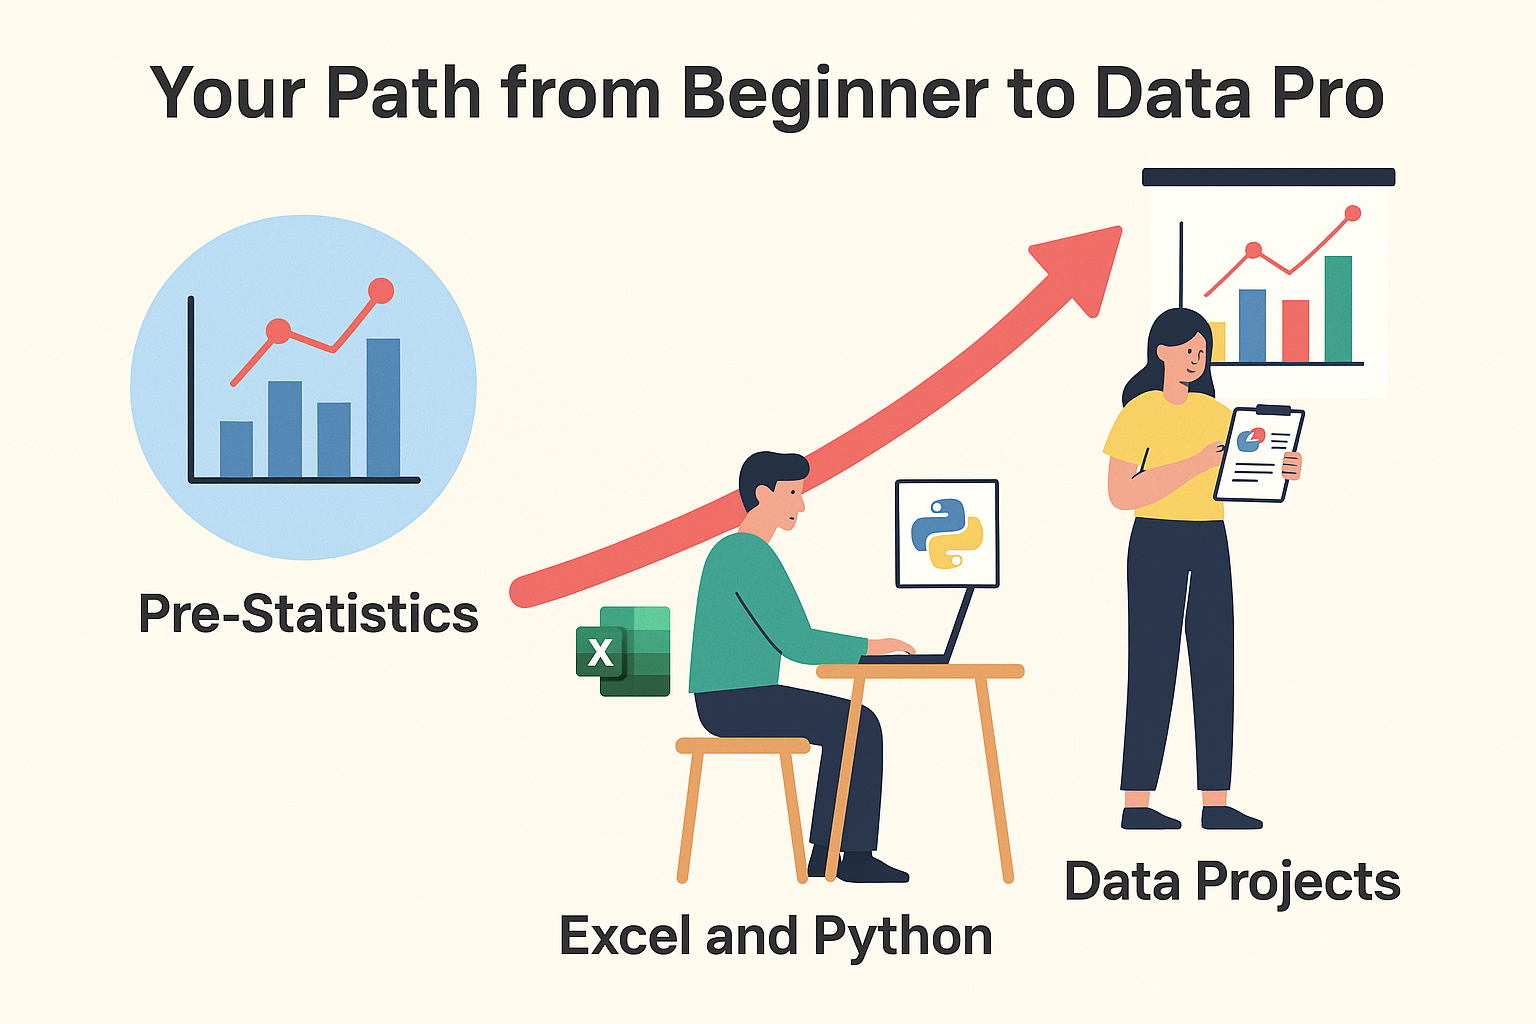
Infographic: Your Path from Beginner to Data Pro
Online Tools You Can Try Right Now
Here are some beginner-friendly tools to start practicing:
- Google Sheets – Make basic charts and tables
- Khan Academy – Learn basic statistics (free)
- DataCamp’s Pre-Stat Course – For total beginners
- Math is Fun – Friendly explanations of tricky topics
You don’t need to be a math genius. You just need to start.
Tips to Make Learning Easier
- Practice with real data (like your monthly expenses or a sports stat)
- Watch explainer videos for visual learning
- Use flashcards for terms like “mode” and “probability”
- Don’t rush—master the basics first
Final Thoughts
Pre-Statistics and Data Science is your launchpad.
Before you tackle big data, machine learning, or coding tools, build a solid base. Learn the terms, understand the numbers, and see patterns in simple charts.
Once you get the basics right, the rest becomes much easier—and a lot more fun.
FAQ: Pre-Statistics and Data Science
Q1. What is Pre-Statistics and Data Science?
A:
It’s the starting point for anyone new to data science. It covers the basics—like simple math, logic, and reading graphs—so you can understand data before moving on to tools like Python or Excel.
Q2. Why should I learn pre-statistics before starting data science?
A:
Because without it, you’ll feel lost. Pre-statistics gives you the foundation. You’ll understand averages, percentages, and how to read data, which makes learning advanced topics easier and less frustrating.
Q3. Do I need a strong math background to start?
A:
Not at all. Pre-statistics is designed for beginners. If you know how to add, subtract, and read simple graphs, you’re ready to start.
Q4. What topics are included in pre-statistics?
A:
You’ll learn:
- Averages (mean, median, mode)
- Percentages and ratios
- Data types
- Simple probability
- Reading and making basic charts
These are all practical skills you’ll use in real-world data projects.
Q5. Is it possible to learn pre-statistics on my own?
A:
Yes! There are many beginner-friendly resources online—like Khan Academy, YouTube, or free mini-courses. You can even start by analyzing your own data like expenses or daily routines.
Q6. How long does it take to learn pre-statistics?
A:
You can learn the basics in 2–4 weeks with regular practice. It depends on your pace and how much time you dedicate daily. The key is to stay consistent.
Q7. Do I need to know programming (like Python) first?
A:
No. Pre-statistics comes before coding. Once you understand the basics of data and statistics, then it’s easier to learn how to code with tools like Python or R.
Q8. How is pre-statistics used in real life?
A:
Everywhere! Businesses use it to track sales. Weather apps use it to show forecasts. Sports teams use it to study performance. It helps in making better decisions with data.
Q9. Can this help me get a job in data science?
A:
Yes, it’s your first step. Employers want people who understand data, even at a basic level. Once you master pre-statistics, you can move on to data analysis, and then explore career options in data science.
Q10. What comes after pre-statistics?
A:
After pre-statistics, you’ll be ready to:
- Use Excel and Google Sheets
- Learn data visualization
- Start coding in Python
- Explore real datasets
- Build mini data projects
This is where you start building your portfolio.